A new S&P 500 rolling returns tool
I just added a new page to Market Return Data: S&P 500 Rolling Returns. It shows every 1- to 30-year holding period for the S&P 500, starting each month, with data back to 1871.
The chart below sums up what it shows. Since 1950, the worst 12-month stretch for the S&P 500 was a 41% loss and the best was a 60% gain. Stretch the holding period to 15 years and every single period finished positive. The worst 30-year stretch still compounded at about 9% a year.
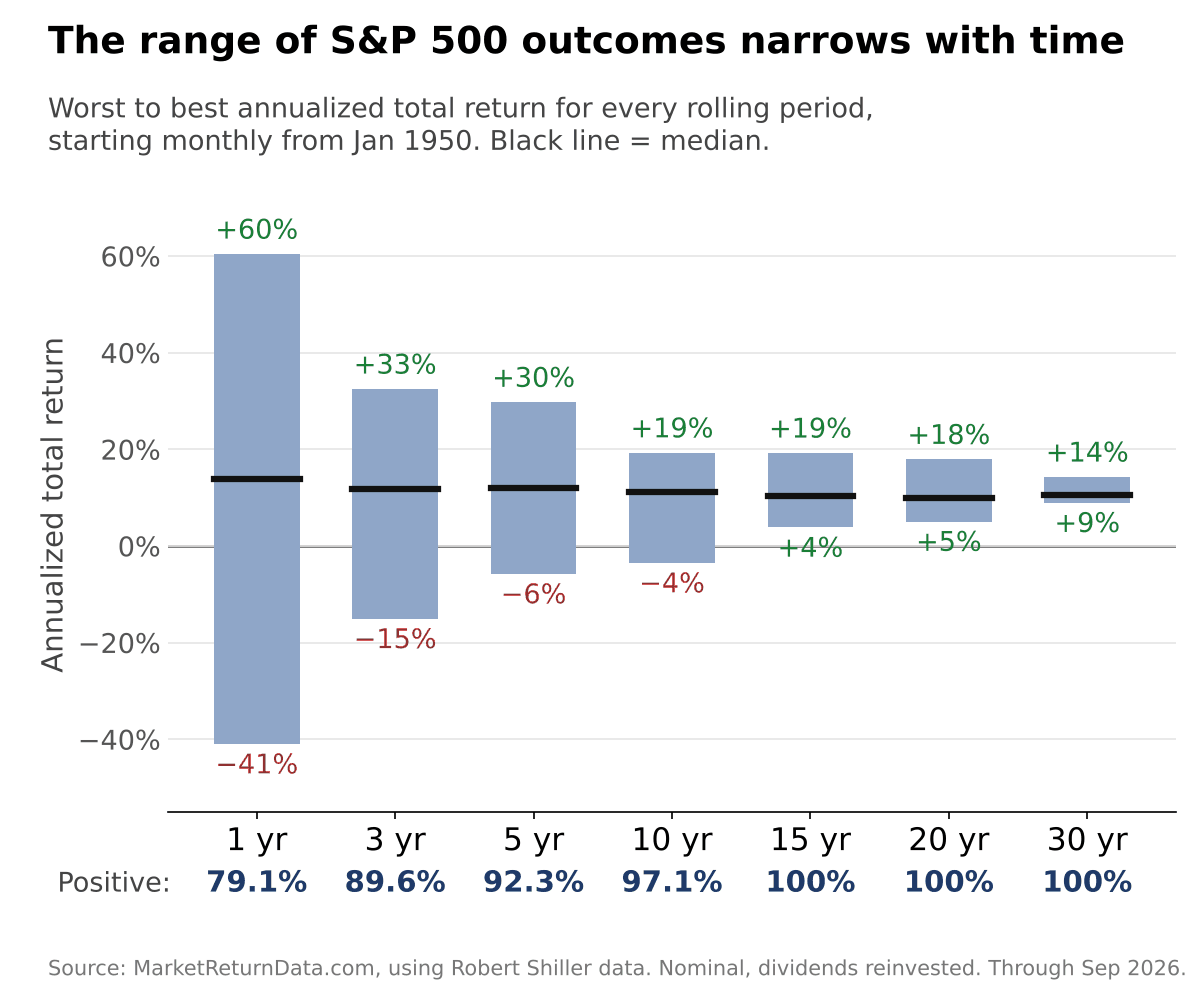
The middle of the range barely moves. The median return lands between roughly 10% and 14% a year no matter how long you hold. What changes is how far the outcomes stray from it.
You can switch to after-inflation returns or pick any starting year back to 1871 and see how the picture changes.