I came across this on X. It's usually credited to Nadine Stair, 85, of Louisville, but it appears to be adapted from a 1931 essay by Don Herold.
"If I Had My Life to Live Over," as it usually circulates. Adapted from Don Herold's "I'd Pick More Daisies," College Humor, December 1931. Quote Investigator.
Either way, it's a lovely thought. We spend far too much time planning and too little living.
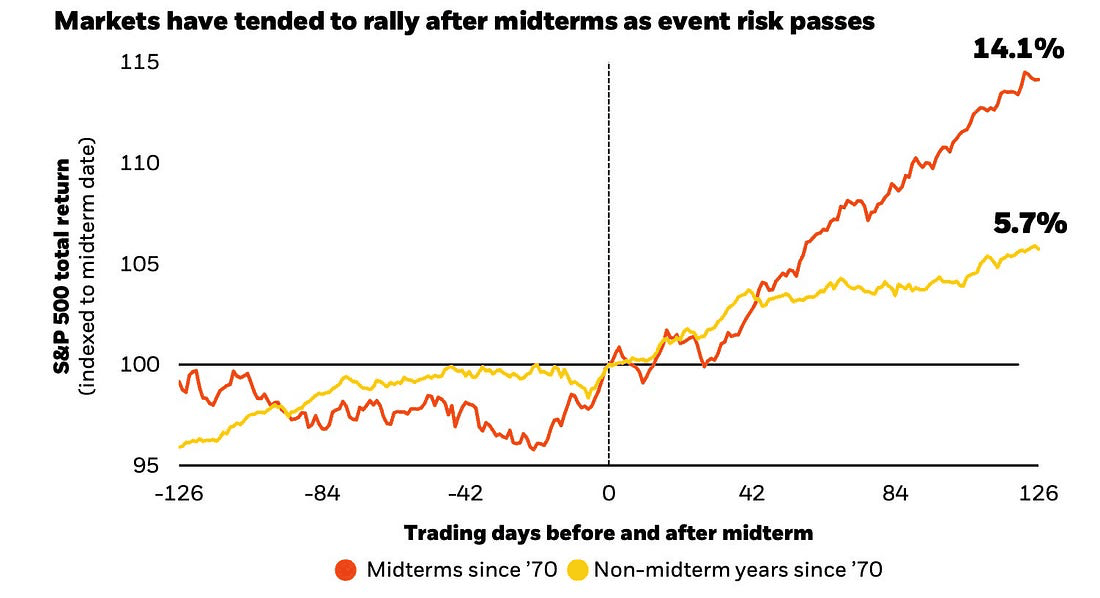
Today, Nov. 3, is Election Day. Since 1970, the S&P 500 has averaged a 14.1% total return in the six months after a midterm election, compared with 5.7% over the same stretch in other years. BlackRock's explanation is that a big source of uncertainty gets cleared away.
Average S&P 500 total return around midterm elections (1970–2022) vs. the same window in non-midterm years, indexed to election day. BlackRock, using Bloomberg data as of Aug. 13, 2026.
Jeffrey Hirsch of the Stock Trader's Almanac has noted that the strongest six-month stretch of the four-year presidential cycle has historically started in November of midterm years. As Sam Ro points out at TKer, there's no guarantee the pattern repeats. Fourteen elections is a small sample, but it's not nothing.
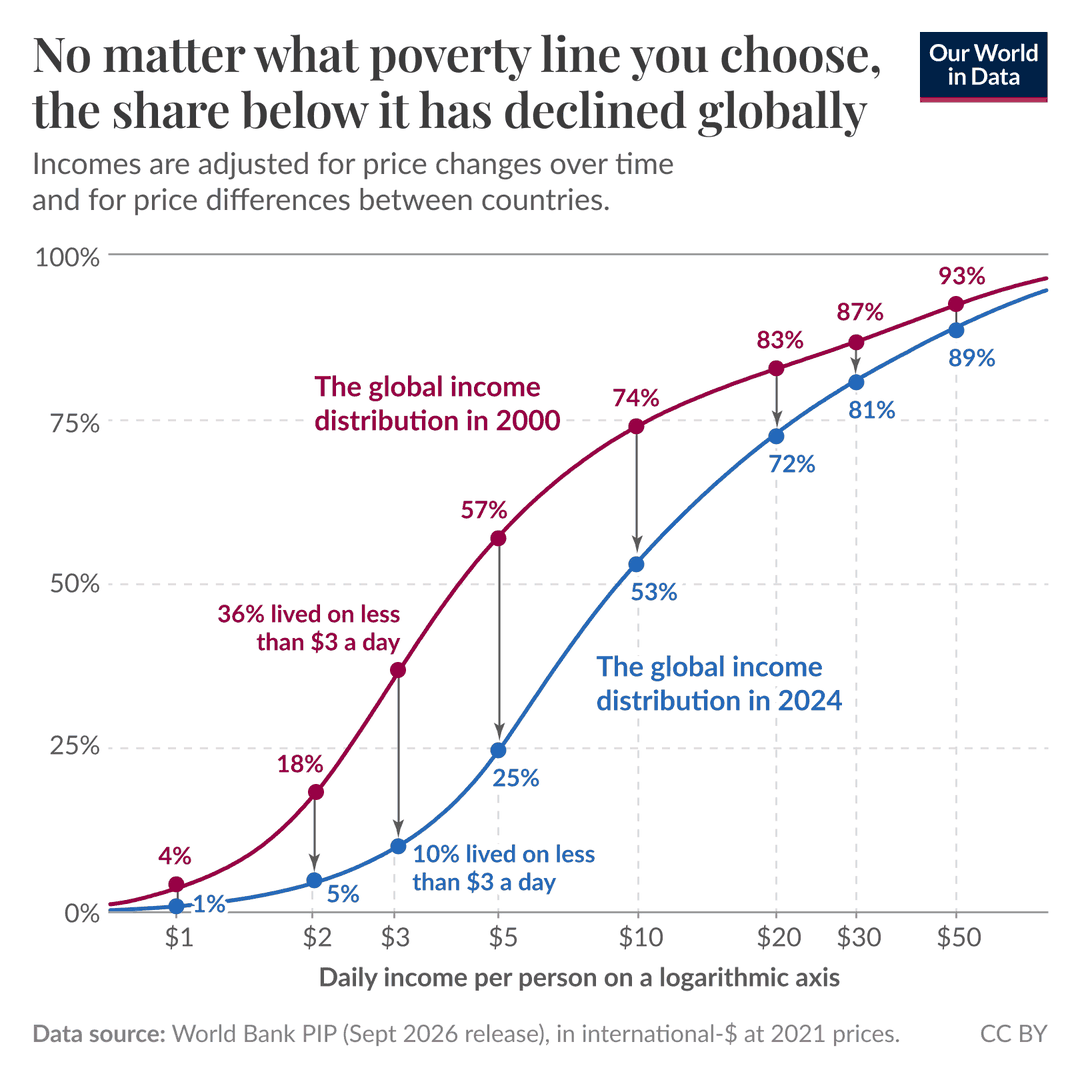
A lot of naysayers like to argue that global poverty is only falling because the poverty line is set so extraordinarily low. Well, it turns out that no matter where you draw the line, the share of people living below it has fallen since 2000. At $3 a day, it dropped from 36% to 10%. At $10 a day, from 74% to 53%.
Share of the world's population living below each daily income level, 2000 vs. 2024, adjusted for inflation and cost-of-living differences. Our World in Data, using World Bank data.
As usual, the progress continues with very little attention from the mainstream media.
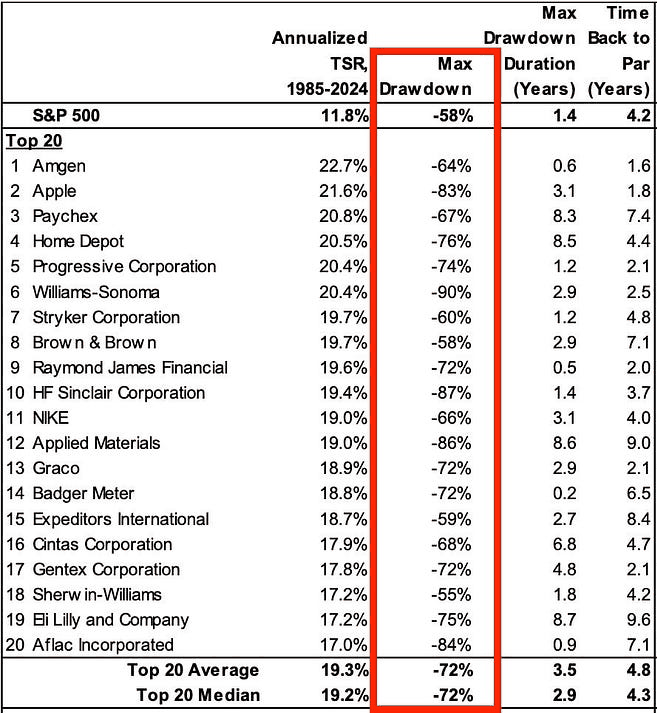
In May 2025, Morgan Stanley's Michael Mauboussin and Dan Callahan studied the price history of more than 6,500 U.S. stocks. The chart below shows the 20 with the best total shareholder returns from 1985 to 2024. At its worst, the median stock in that group fell 72% from its peak. After hitting bottom, it took 4.3 years to get back to its old high. For comparison, the S&P 500's worst drop over the same period was 58%.
Maximum drawdowns and recoveries for the 20 U.S. stocks with the highest total shareholder returns, 1985–2024. Adapted from Morgan Stanley, via Sam Ro.
I just added a new page to Market Return Data: S&P 500 Rolling Returns. It shows every 1- to 30-year holding period for the S&P 500, starting each month, with data back to 1871.
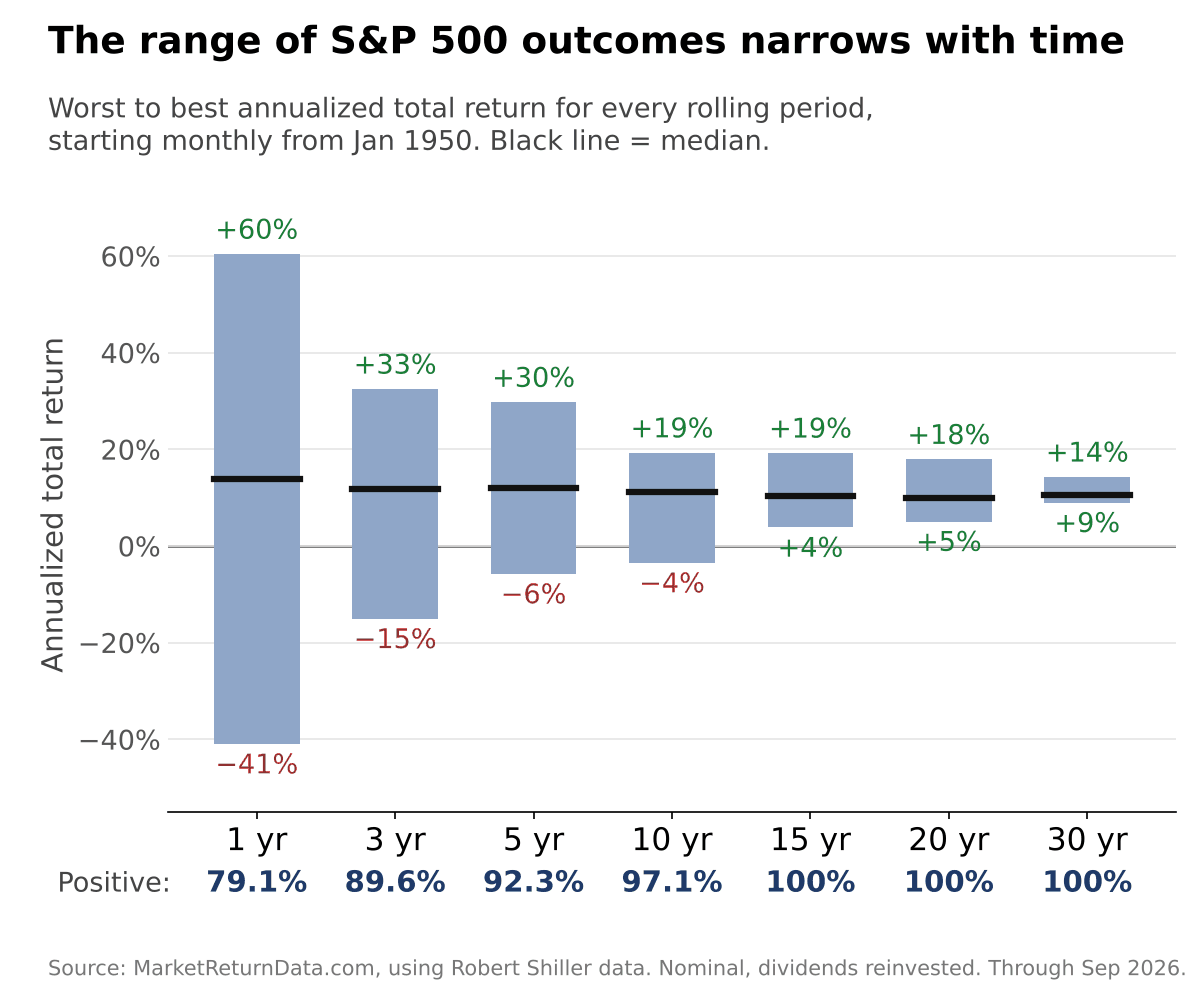
The chart below sums up what it shows. Since 1950, the worst 12-month stretch for the S&P 500 was a 41% loss and the best was a 60% gain. Stretch the holding period to 15 years and every single period finished positive. The worst 30-year stretch still compounded at about 9% a year.
Worst, median, and best annualized S&P 500 total returns for every rolling period starting monthly, January 1950–September 2026, nominal, dividends reinvested. Market Return Data, using Robert Shiller's data.
The middle of the range barely moves. The median return lands between roughly 10% and 14% a year no matter how long you hold. What changes is how far the outcomes stray from it.
You can switch to after-inflation returns or pick any starting year back to 1871 and see how the picture changes.
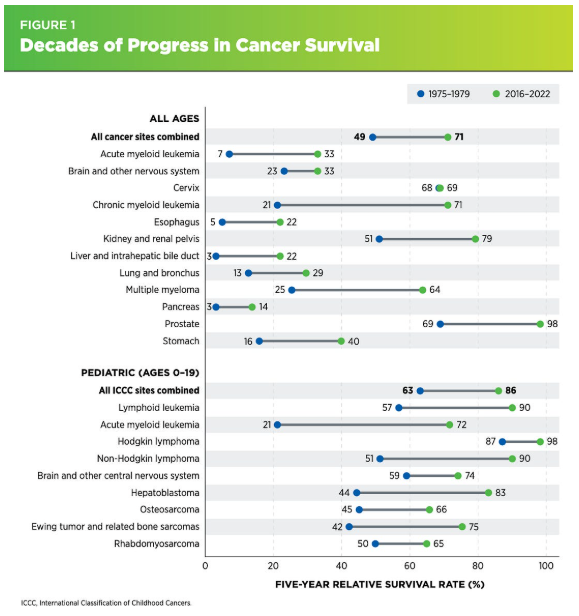
It’s hard to “see” progress because progress is often defined by the number of people who aren’t dying of cancer or heart disease, who aren't starving, or who aren’t living in the dark without electricity (among other things).
We don’t see that kind of progress because we’re focused on the people still suffering, and so it looks like very little is changing.
But rest assured, progress is being made. As just one example, look at the chart below. The five-year relative survival rate for US cancer patients rose from 49% for those diagnosed in 1975–1979 to 71% for those diagnosed in 2016–2022, according to the American Association for Cancer Research’s 2026 Cancer Progress Report (h/t Human Progress).
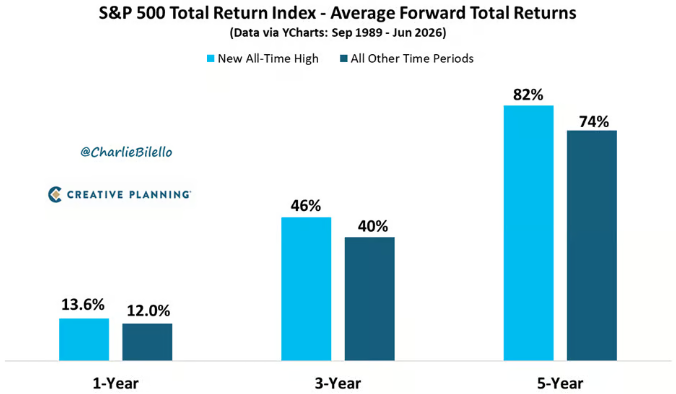
One of the more counterintuitive market stats I’m aware of (if not the most counterintuitive) is that market returns are actually better, on average, following an all-time high than at other times. And it's not just the short-term (1-year) returns that are better, but the 3- and 5-year returns are better than all other time periods too.
Average S&P 500 forward total returns after a new all-time high vs. all other time periods, September 1989–June 2026. Charlie Bilello, Creative Planning.
Let this be your reminder that all-time highs may not be a time to sell, but to stay the course. Or maybe even, to double down.
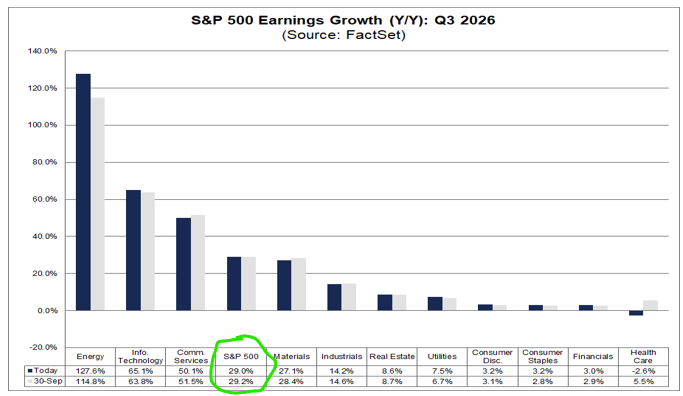
Stocks keep climbing despite all the turmoil and poor sentiment. If you're wondering why, look at earnings.
According to FactSet, S&P 500 earnings for Q3 are on pace to grow 29.0% from a year ago. If that holds, it will be the third straight quarter of earnings growth above 25%.
Q3 2026 year-over-year earnings growth by sector, October 16 vs. September 30. Source: FactSet.
And companies usually beat the estimates. Based on how much the growth rate has typically risen during past earnings seasons, FactSet projects the final number will land above 35%.
Over time, stock prices follow earnings. When profits are growing this fast, a rising market makes a lot more sense, even when the mood says otherwise.
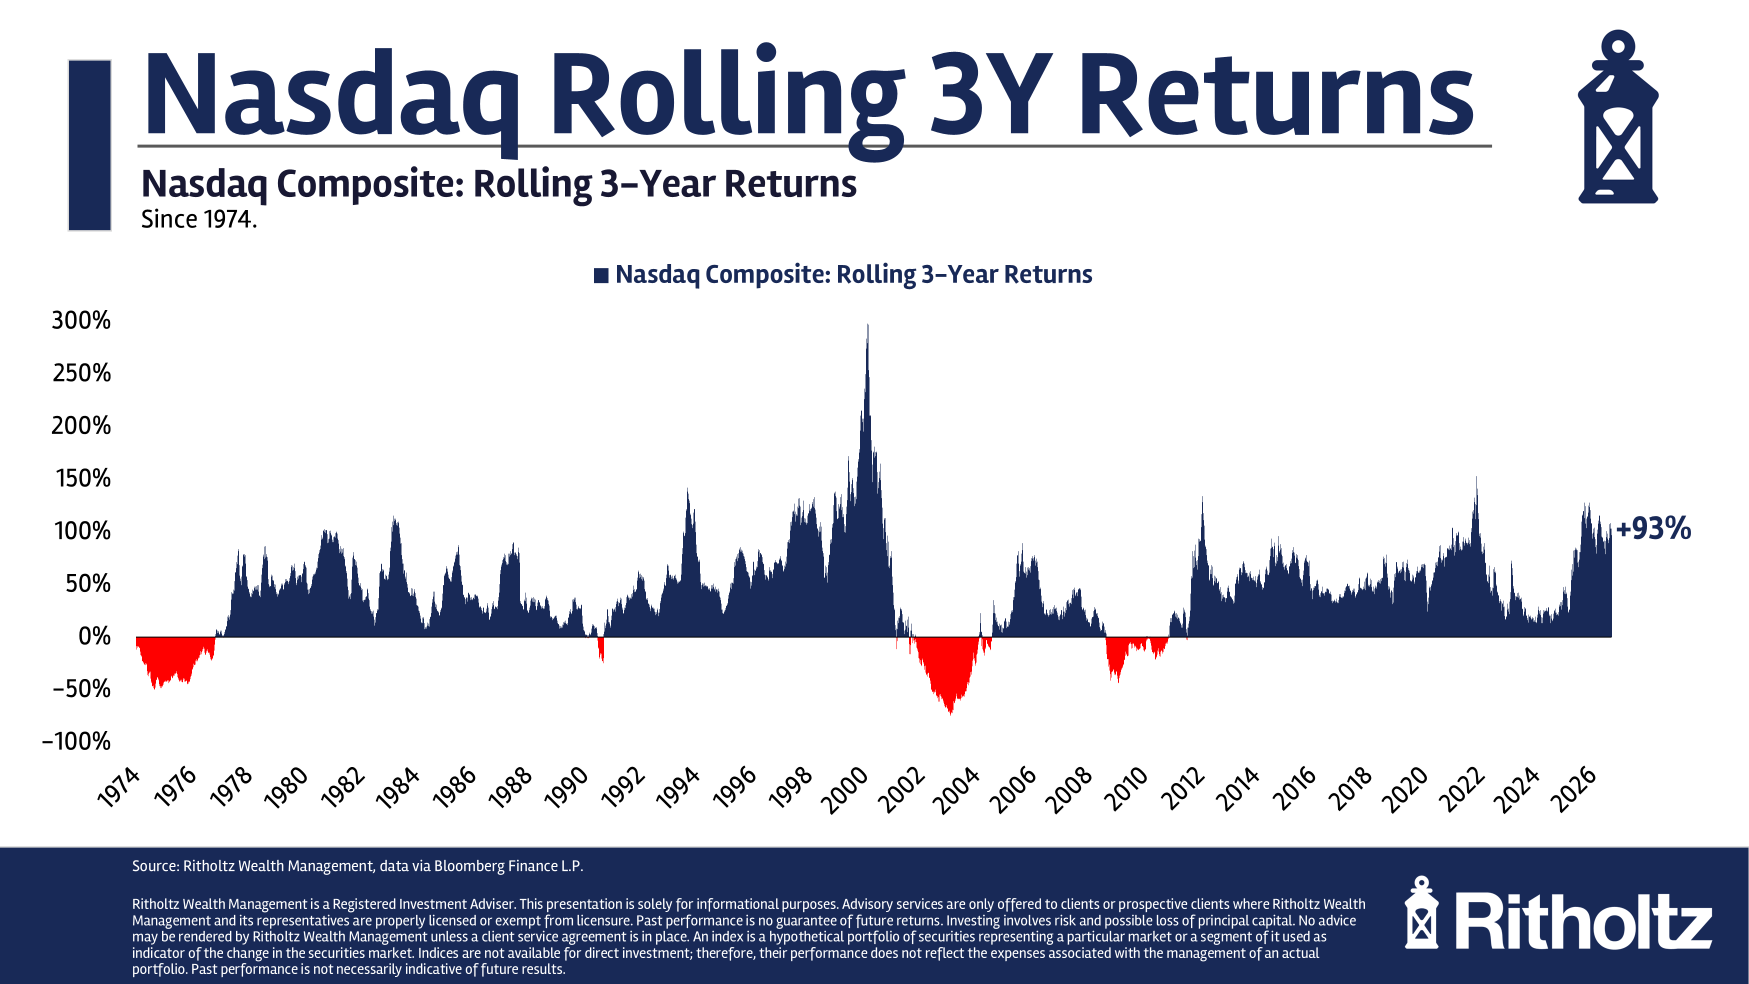
Many pundits have pointed to the Nasdaq's recent run, up 93% over the past three years, as proof we're in another tech bubble.
Nasdaq Composite rolling three-year returns, 1974–2026. Ritholtz Wealth Management, data via Bloomberg Finance L.P., from Barry Ritholtz's "Top? Beware Your Confirmation Bias".
The comparison falls apart once you look at the Nasdaq's rolling three-year returns going back to 1974. Three-year gains of 100% or more have happened several times, including the early 1980s, the early 1990s, the early 2010s, and 2021. It's the late '90s, when three-year returns hit nearly 300%, that remain (for now) a one-time anomaly.
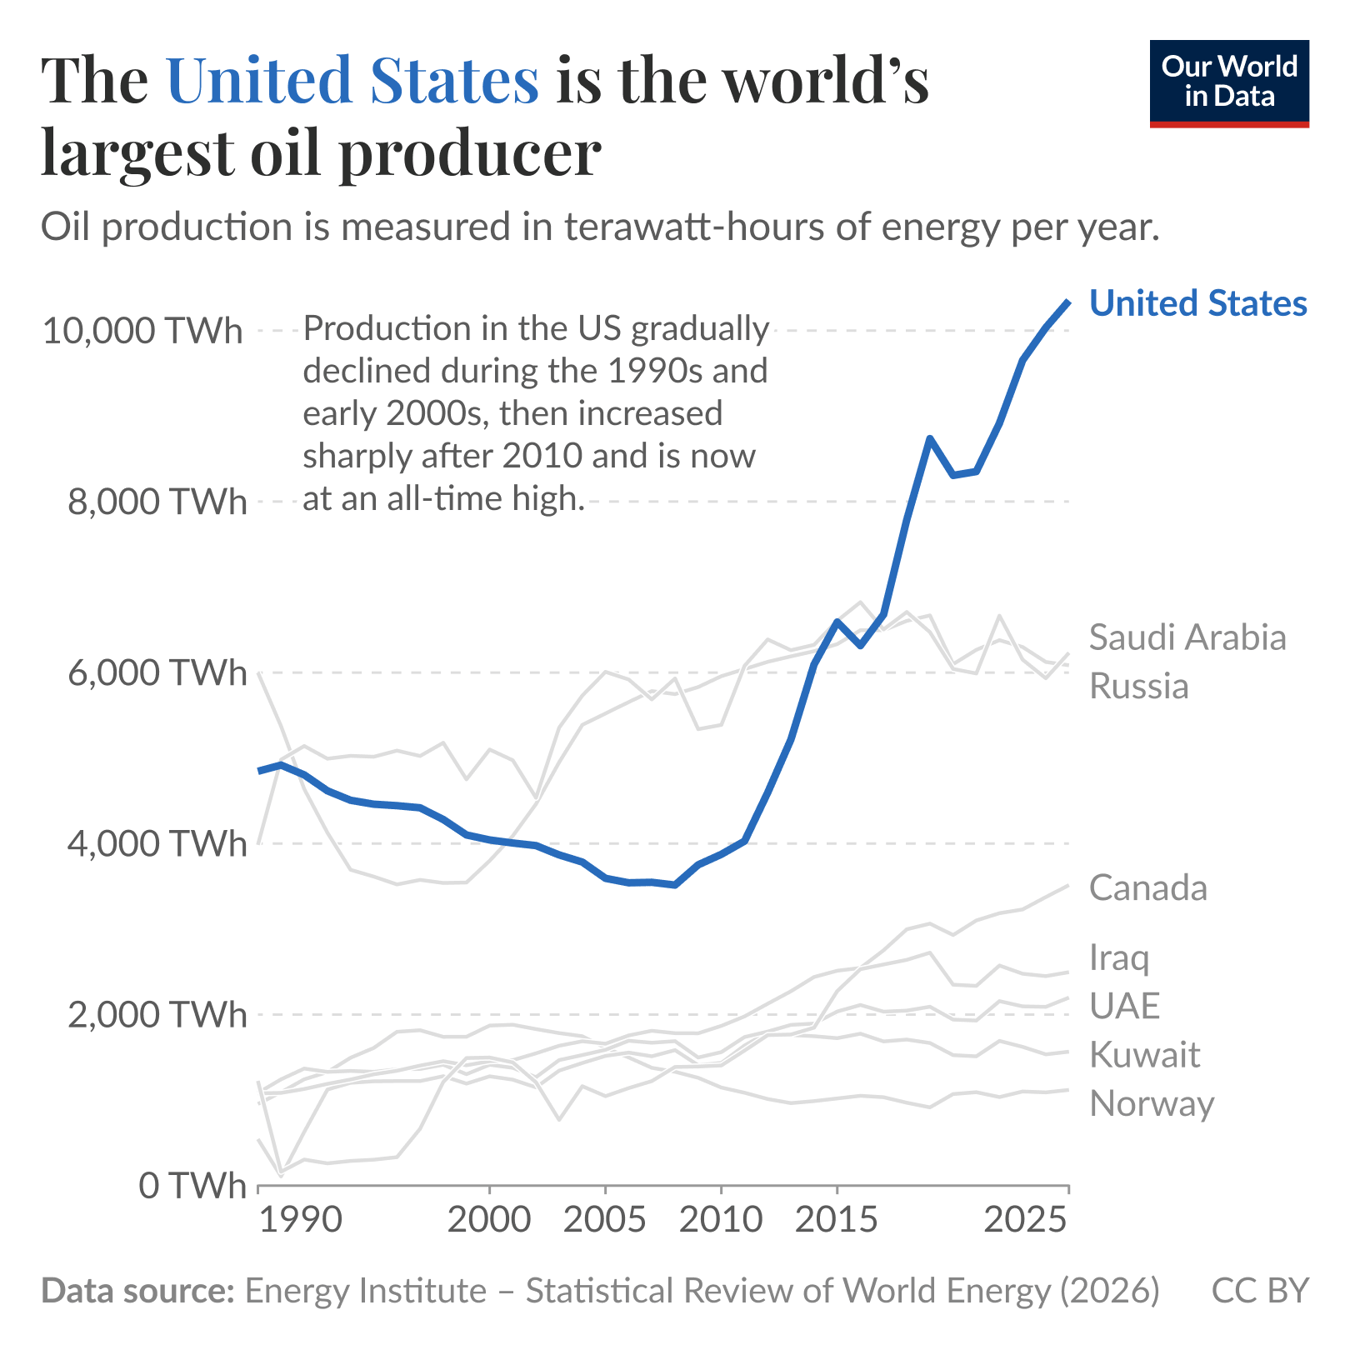
If I asked you to name the world's largest oil producer, I'll bet you'd name a Middle Eastern country. And you'd be wrong.
The United States passed Saudi Arabia and Russia for the top spot in 2018 and hasn't looked back. As the chart below shows, the lead keeps growing. Pretty fascinating.
Oil production by country, in terawatt-hours per year, through 2025. Our World in Data, using the Energy Institute Statistical Review of World Energy (2026).