A 4% drop is more common than you think
A 4% drop in the market isn't as unusual as you might think. By my count (using Bespoke's chart), there have been 53 since 1980. That's more than one per year.
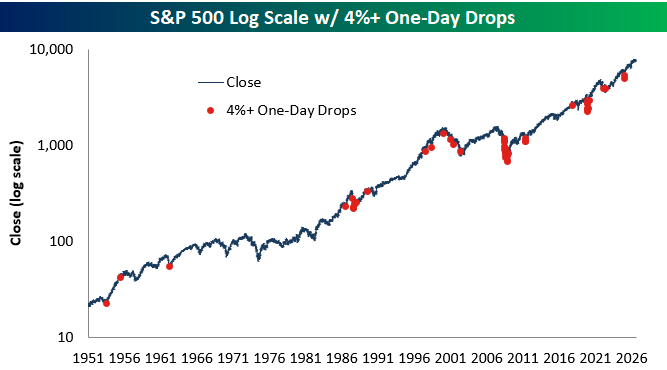
But what each of those drops has in common is that, looking back, every single one of them was a buying opportunity.
I suspect we'll look back on Thursday's drop in exactly the same way, given a little bit of time.