A few interesting stats from a rough week in the market
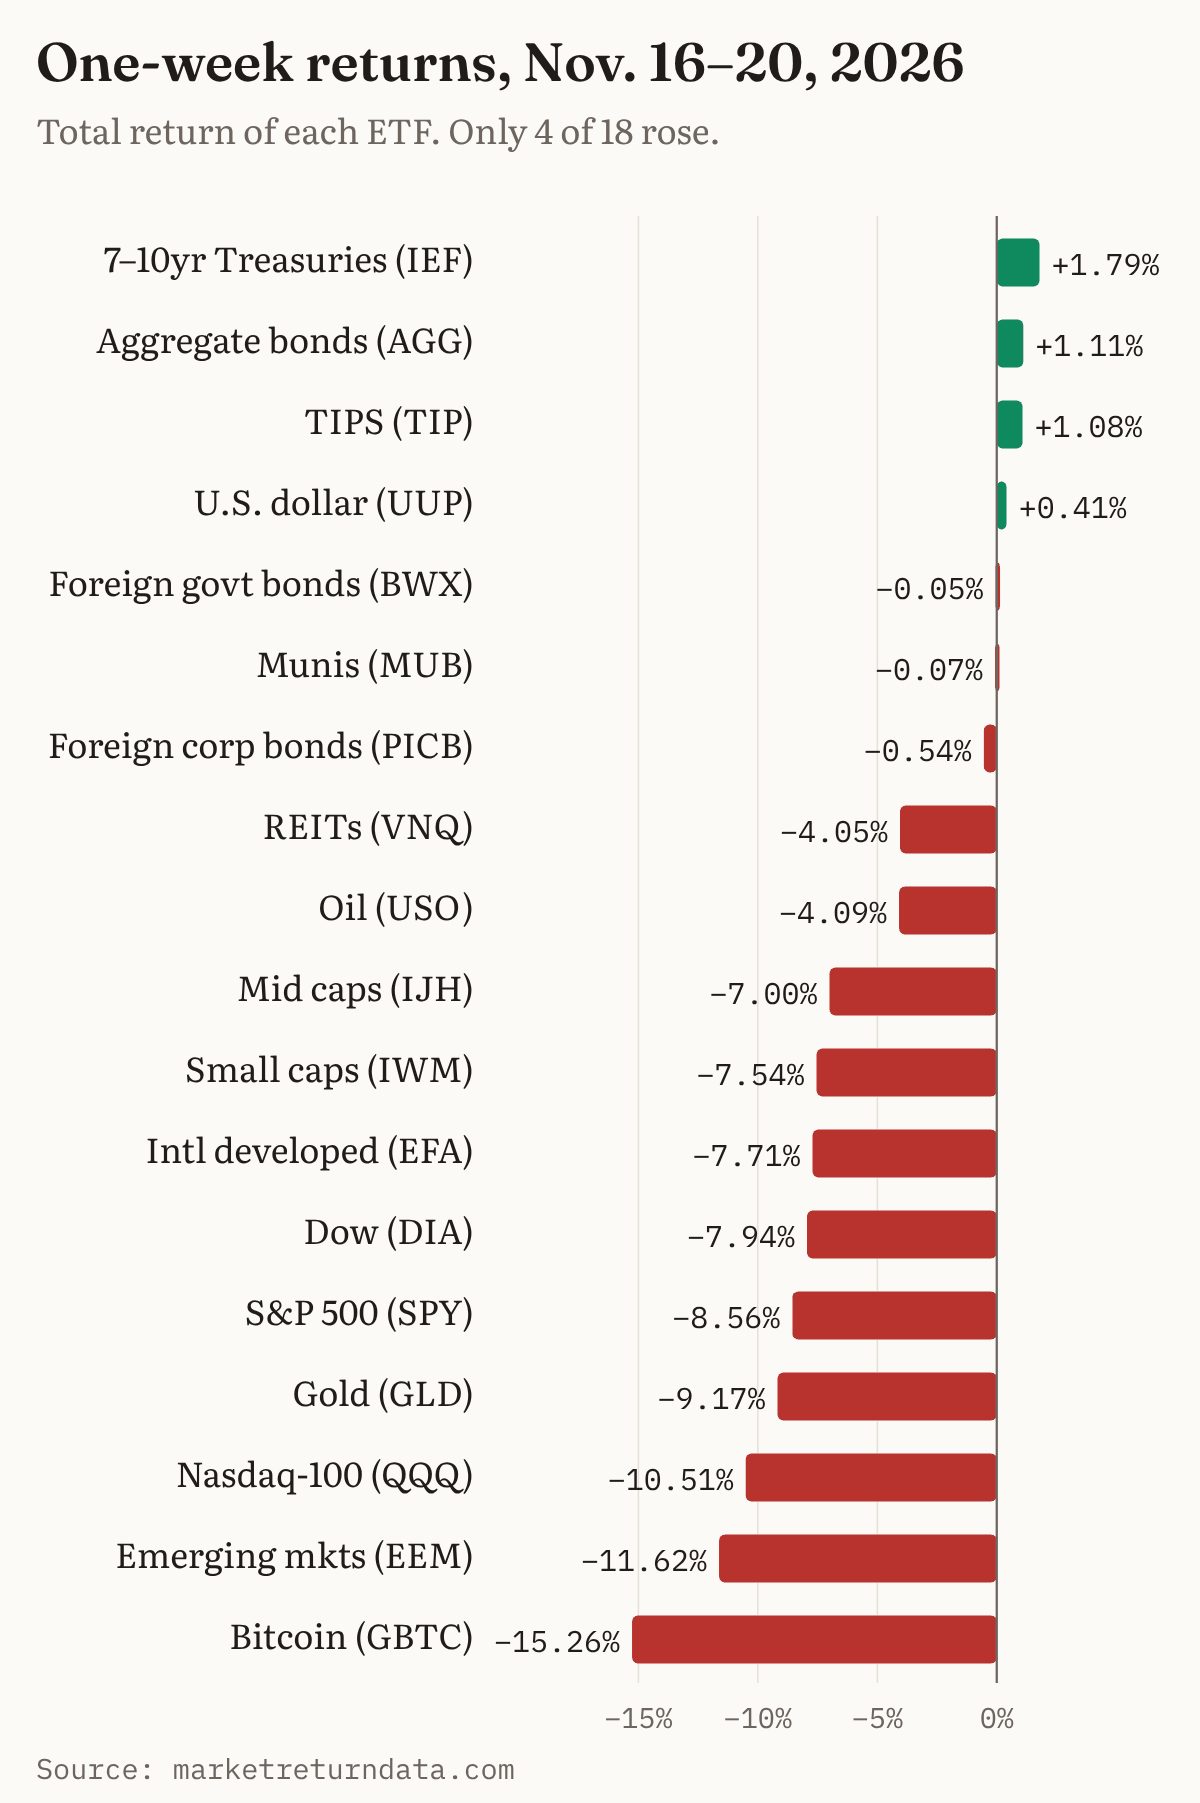
This is one of my favorite visuals I've created (though I'm not sure anyone agrees with me).

It felt fitting, because this week (Nov. 16–20) was a rough one. The S&P 500 fell more than 8% from Monday to Friday, and a lot of the numbers that came out of it were hard to believe. Here are a few that stood out to me.
→ 5
The S&P 500 fell every day this week, and four of those days were drops of 1% or more. According to Yahoo Finance, that had happened only five times before: 1962, 1974, 1978, the week after 9/11, and October 2008.
→ 7 in 10
Shortly after Friday's opening bell, 71 of the 101 stocks in the Nasdaq-100 were at least 20% below their all-time highs, including 20 of its 22 chip and memory stocks, according to Benzinga. That puts most of the index's companies in bear market territory, even though the index itself only got to around that 20% line by Friday's close.
→ 103%
That's how much Nvidia's revenue grew from a year earlier in the quarter it reported on Nov. 17, and it beat Wall Street's estimates. The stock still fell about 23% for the week, according to Yahoo Finance. Part of that was the fallout from Jensen Huang's resignation as CEO and a reported SEC investigation. Even so, it's a good reminder that a company's results and its stock price can head in very different directions for a while.
→ $111.50 to $88.91
Anthropic priced its IPO at $83 a share on Nov. 18. On Thursday it opened at $111.50, a 34% pop. By Friday's close it was at $88.91, only about 7% above the offering price (Yahoo Finance). That's a lot of excitement to give back in two trading days.
→ −9% and −15%
Gold and bitcoin both get talked about as places to hide when stocks fall, and neither one held up this week. Gold (GLD) fell 9.17% and is now down 18.53% for the year. Bitcoin (GBTC) fell 15.26% and is down 34.22% for the year, with bitcoin itself dropping below $60,000 on Friday (Yahoo Finance). As the chart below shows, high-quality bonds were about the only thing that finished the week higher.
→ 51.2
That's where the NAAIM exposure index finished, down from 72.9 the week before. The index tracks how much stock active money managers hold, and it was the biggest one-week drop since April 2025. In other words, the pros got a lot more cautious after prices had already fallen. TheStreet counted 19 drops like this since 2016 (20 points or more, to a reading of 60 or below). In 84% of them, the S&P 500 was higher 13 weeks later.
Weeks like this are scary while you're living through them. But looking back, almost every period of volatility ends up being viewed as an opportunity, given the benefit of time. I hope you're out there buying. I certainly am!
These stats come from the Nov. 21 edition of The Benchmark, my weekly markets newsletter. Subscribe here to get it every Saturday.