Stocks have tended to rally after midterms
Today, Nov. 3, is Election Day. Since 1970, the S&P 500 has averaged a 14.1% total return in the six months after a midterm election, compared with 5.7% over the same stretch in other years. BlackRock's explanation is that a big source of uncertainty gets cleared away.
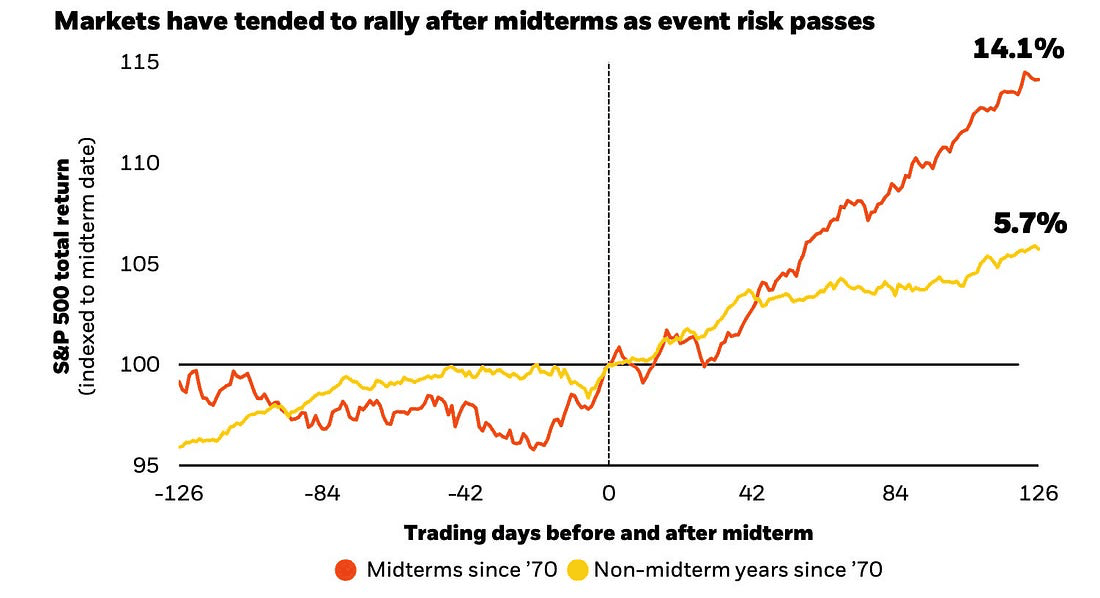
Jeffrey Hirsch of the Stock Trader's Almanac has noted that the strongest six-month stretch of the four-year presidential cycle has historically started in November of midterm years. As Sam Ro points out at TKer, there's no guarantee the pattern repeats. Fourteen elections is a small sample, but it's not nothing.