Log charts make the gap look smaller than it is
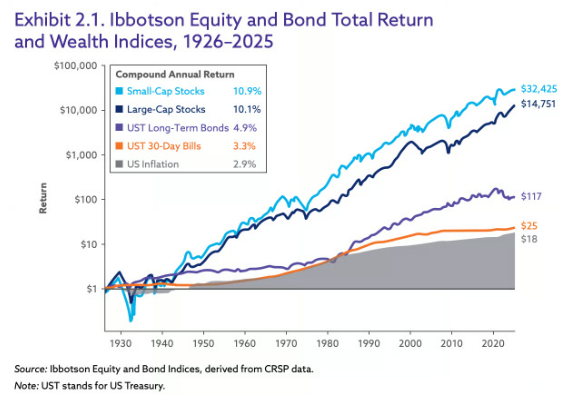
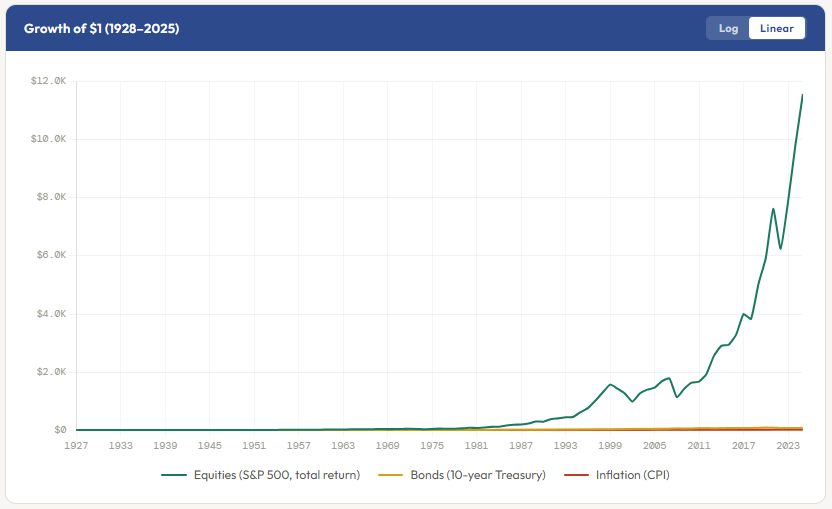
The problem with log-scale charts like the first one below is that they make the returns look much closer than they actually are. The second chart shows roughly the same data (mine only goes back to 1928 and doesn't include small-cap, etc.), but in linear form. As you can see, the difference in returns is so stark that bonds and inflation look like they're part of the x-axis as equities ran away from both over time.
For investing time horizons measured in decades, be sure to do the math on what you're giving up to avoid equity's temporary (in the US, historically always temporary) volatility. It's far, far greater than what most people think.